
1.    Introduction
2.    Investigation
2.1   The Seventeen Tones of Western Music - Really!
2.2   Development of Scales (and more)
2.3   Harmony and Musical Chords"
2.3.1 Just Intonation
2.3.2 Equal Temperameent
2.4   Figuring Out a Couple of Things
3.    Conclusions
4.    Acknowledgements
5.    Bibliography
This paper did not start out as an investigation of some aspects of the mathematical foundations of music. Instead, its humble beginning was to gain an understanding of why the black keys on the piano are where they are. Everything else followed. It all began when I read one sentence in an article in the Washington Post stating that the chromatic tones could be determined by computing powers of three-halves and four-thirds. The Washington Post article used the term Chromatic Scale to indicate an untempered scale consisting only of tones generated by powers of three-halves and four-thirds. For over fifty years, I had been puzzled by the positions of the white and black keys. No explanation ever provided me with a satisfactory answer. Learning of equal temperament tuning, with the ratio of frequencies for the 12 keys of an octave each separated by the 12th root of two deepened the mystery for me. Starting at age six, I had a few years of piano lessons but I had never had the patience to become an accomplished pianist. I quit before I was twelve. I was left with the mystery and the remembrance of the location of Middle C. The Washington Post article inspired me to sit down with a spread sheet with the hope that I could spend a few hours with it and come to an understanding of the layout of keys on the piano. In my calculations, I was working only with ratios of three-halves and four-thirds, not with a tempered scale. Within a few days, I did find the pattern in the data which explains the layout of black and white keys. What was unexpected, was that I also found a method for simply extracting the notes for any of the twelve keys of Western music and also discovered I could compute the ratio of frequencies between, for example, G♯ and A♭ . On the piano, tempering results in the adjacent G♯ and A♭, A♯ and B♭ and the other three sharp/flat doublets each being reduced to a single black key. I did not do anything further in examining the sharp/flat doublets. All of the above, I did in the first couple of weeks. A little later I wrote a few pages describing what I had done. I also made diagrams showing the extraction of each of the twelve scales. Making the diagrams was the most tedious part. I did nothing more for some six years until several months ago when I went back, reviewed what I had done and discovered there was still considerably more that I could tease out by going beyond what I had done previously. Since ratios of four-thirds and three-halves correspond to musical terms of perfect fourth and perfect fifth chords, I was led to other chords and to harmony. Comparing Pythagorean tuning and Equal Temperament Tuning led to considering how the first evolved into the second. Along the way, I developed simple methods to transpose tones from one scale to another and to determine, for example, all the positions of perfects fifths in any musical key. This paper follows my explorations and I have the hope that the reader will share some of my sense of excitement and awe at the beauty of how the simple beginnings of Pythagorean tuning lead to magnificent structures which still form the framework of Western music, both classical and popular. Thus I explain the genesis of this paper.
Note: Throughout the paper, I have tried to select references that can easily be found by the reader over the internet. If this paper were a learned treatise for the cognoscenti, I would follow the rules for using established references wherever possible. Since I am not a member of the musical-theory cognoscenti and have difficulty reading the learned articles, I have used Wikipedia and other web sites whenever possible. I use my judgment and cross-referencing between sources to determine whether specific sources are credible. Throughout the paper, I have tried to derive results in a manner that can be followed by a reader without a musical background or a knowledge of math beyond first-year algebra, The main requirement for the reader is the ability to follow a logical argument.
Before we get started, I want to insert a couple of definitions, First, a chromatic scale (ref. 1) divides an octave into 12 semitones where there is a single step between semitones and with two semitones per tone. Each semitone is a specific musical pitch corresponding to a sound wave frequency. The semitones are not necessarily equally spaced. In contrast, a diatonic scale (ref. 2) divides the octave into seven tones where five of the tones are two steps apart and the other two are a single step apart. The tones that are a single step apart are maximally displaced from each other.
2.1 The Seventeen Tones of Western Music - Really!
My basic starting point was to first compute a list of frequencies that could be generated by powers of four-thirds and three-halves. Here is the equation I used to generate a two dimensional array of frequencies
| fnorm(m,n) = (4/3)m (3/2)n. | (1) |
where fnorm is the normalized frequency while actual sonic frequencies(what we hear) will be represented by multiplying fnorm by some constant. The normalized values between 1.0 and 2.0 represent the first octave, between 2.0 and 4.0 the second, and finally between 32.0 and 64.0 representing the fifth octave. The actual sound frequencies that we hear are represented by the equation
| f(m,n) = kfnorm(m,n). | (2) |
For example, setting k to 110 hz (which is an A two octaves below the the standard A used by American symphony orchestras) and with m = 0 and n = 0, then f(0,0) = 110 hz. Also, f(0,1) = 1.5 * 110 = 165 hz. The reason, I did not simply replace k by 110 hz was that I wanted a constant such that eq. 2 would result in C major with the keys of the scale being restricted to white notes. Thus, the value of K to be used was unknown.
| Table 1 Matrix of Powers of Four-thirds and Three-halves | |||||||||||
| 0 | 1 | 2 | 3 | 4 | 5 | 6 | 7 | 8 | 9 | 10 | |
| 0 | 1.00 | 1.50 | 2.25 | 3.38 | 5.06 | 7.59 | 11.39 | 17.09 | 25.63 | 38.44 | 57.67 |
| 1 | 1.330 | 2.00 | 3.00 | 4.50 | 6.75 | 10.13 | 15.19 | 22.78 | 37.17 | 51.26 | 76.89 |
| 2 | 1.78 | 2.67 | 4.00 | 6.00 | 9.00 | 13.50 | 20.25 | 30.38 | 45.56 | 68.34 | 102.52 |
| 3 | 2.37 | 3.56 | 5.33 | 8.00 | 12.00 | 18.00 | 27.00 | 40.50 | 60.75 | 91.13 | 136.69 |
| 4 | 3.16 | 4.74 | 7.11 | 10.67 | 16.00 | 24.00 | 36.00 | 54.50 | 81.00 | 121.00 | 182.25 |
| 5 | 4.21 | 6.32 | 9.48 | 14.22 | 21.330 | 32.00 | 48.00 | 72.00 | 108.00 | 162.00 | 243.00 |
| 6 | 5.62 | 8.43 | 12.64 | 18.96 | 28.44 | 42.67 | 64.00 | 96.00 | 144.00 | 216.00 | 324.00 |
| 7 | 7.49 | 11.24 | 16.86 | 25.28 | 37.93 | 56.89 | 85.33 | 128.00 | 192.00 | 288.00 | 432.00< |
| 8 | 9.99 | 14.98 | 22.47 | 33.71 | 50.57 | 75.85 | 113.78 | 170.67 | 256.00 | 384.00 | 576.00 |
| 9 | 13.32 | 19.98 | 29.97 | 44.95 | 67.42 | 101.14 | 151.70 | 227.56 | 341.33 | 512.00 | 768.00 |
| 10 | 17.76 | 26.64 | 39.95 | 59.93 | 89.90 | 134.85 | 202.27 | 303.41 | 455.11 | 682.67 | 1024.00 |
| 11 | 23.68 | 35.52 | 53.27 | 79.91 | 119.86 | 179.80 | 269.70 | 404.54 | 606.81 | 910.22 | 1365.30 |
| 12 | 31.57 | 47.35 | 71.03 | 106.55 | 159.82 | 239.73 | 359.59 | 539.39 | 809.09 | 1213.63 | 1820.44 |
| 13 | 42.09 | 63.14 | 94.71 | 142.06 | 213.09 | 319.64 | 479.46 | 719.19 | 1078.78 | 1618.17 | 2427.26 |
| 14 | 56.12 | 84.18 | 126.27 | 189.42 | 284.12 | 426.19 | 639.28 | 938.92 | 1438.38 | 2157.567 | 3236.35 |
Table 1: Matrix of Values of the Expression fnorm(m,n). Values less than or equal to 64 are in red.
A portion of the matrix generated from eq. 1 is shown above in Table 1. There have to be sufficient columns and rows to insure that that all matrix values up to 64.0 are included in the table. All the table entries were put into a single column and then sorted by order of increasing value. In the next four tables, we will examine the sorted list derived from fnorm(m.n), one or two octaves at a time., extracting what information we can from each table. As stated before, one octave represents a doubling of frequencies and two octaves represents a quadrupling of frequencies. In Table 2, the first column contains the sorted values of fnorm between 1.0 and 4.0. The 2nd column is the ratio of the number to the left divided by the number above it. A piano has 12 keys in an octave with the frequency ratio between adjacent keys equal to the 12th root of 2 or approximately 1.0595. Its square represents two half tones or a full tone. and has a value of approximately 1.1225. Eq. 1 generates all the tones from which the untempered scales can be constructed while the powers of the 12th root of two yield the tones for tempered scales. But the two values can't be that far apart since the tempered scale is an approximation of the untempered scale. The ratios for the tempered scale was all I had for comparison and thus are what I used for Tempered Ratio column in Table 2. In addition to the half tone separation between black keys and white keys, there is also a half-tone separation between B and C and also E and F.
| Table 2: First Two Octaves | ||||||
| Freq. factor fnorm(m,n) |
Ratio | Number of Steps |
Accum Steps |
Tempered Ratio |
Difference of Ratios |
|
| 1.0000 | ______ | |||||
| 1.3333 | | | |||||
| 1.5000 | octave | |||||
| 1.7778 | | | |||||
| 2.0000 | _____ | |||||
| 2.2500 | 1.1250 | 2nd | 1.1225 | 0.0025 | | | |
| 2.3704 | 1.0535 | 1 | 3rd | 1.0595 | -0.0060 | | |
| 2.6667 | 1.1250 | 2 | 5th | 1.1225 | 0.0025 | | |
| 3.0000 | 1.1250 | 2 | 7th | 1.1225 | 0.0025 | octave |
| 3.1605 | 1.0535 | 1 | 8th | 1.0595 | -0.0060 | | |
| 3.3750 | 1.0679 | 1 | 8th | 1.0595 | -0.0084 | | |
| 3.5556 | 1.0535 | 1 | 10th | 1.0595 | -0.0060 | | |
| 4.0000 | 1.1250 | 2 | 12th | 1.1225 | 0.0025 | _____ |
Table 2: List of Normalized Frequencies Between 1 and 4 and With Other Data Described in the Text.
The 3rd column (Number Steps) shows the approximate number of half tones. We cannot expect the values to be precisely an integer because of the approximation between tempered and untempered ratios. The 4th column sums the values in the "Number steps" column over an octave. For convenience, we will represent a half tone as having a value of one and a full tone having a value of two. The fifth column gives the tempered ratio for the number of steps shown in column four. The tempered ratios were computed above for one step (half-tone) and two steps (full tone). The sixth column is the difference between the tempered and untempered ratios. As we see in Table 2 that there are only five values of fnorm(m,n)starting at 1.0 and running up to and through 2.0. Since we are looking for at least eight notes in the octave we will look at the octave starting at fnorm equal to 2.0. Here we find nine normalized frequency values in the second octave range. The ratio values agree within about one percent which is a fairly satisfactory result with the summing of step equal to 12, again the desired result.
We will assume that we have chosen some constant, K, in eq 2, such that the the values of f will correspond to the key of C on the piano, and thus that the scale will consist of only the white notes. We do not need to concern ourselves with what is the value of K at this point. For frequencies between two and four, we generate nine of the 12 half-tones within the octave, one more than that of the standard octave. We can hypothesize that one of these nine tones may represent the tone of a black key on the piano. The number of ratios is one less than the number of notes so we see only eight ratios from 2 in the sequence (3) below. The pattern of the steps for fnorm from two to four is
| Sequence 3 | ||||||||
| n | 1 | 2 | 3 | 4 | 5 | 6 | 7 | 8 |
| No. of Steps | 2 | 1 | 2 | 2 | 1 | 1 | 1 | 2 |
Since we are starting at the normalized frequency of 2.0 the first ratio listed is the ratio between 2.0 and 2.25. Using the hypothesize stated above, we assume one of the eight values in the sequence (3) is a black note. It must then be a '1' in the sequence since a '2' represents the case where there is a black note separating two white notes on the piano. Over a range of two octaves starting with A, the sequence of full tones and half tones on the piano is
| Sequence 4 | ||||||||||||||
| 2 | 1 | 2 | 2 | 1 | 2 | 2 | 2 | 1 | 2 | 2 | 1 | 2 | 2 | |
| A | B | C | D | E | F | G | A | B | C | D | E | F | G | A |
We must combine two of the '1's of sequence (3) when we eliminate the black note since when two white notes are separated by a black note, then the separation between these two white notes must be two. We can do this by combining the 5th and 6th or the 6th and 7th values of the sequence. On sequence 4, there is the sub-sequence 2122 which can not be modified by eliminating a black note from it. Let us look for this sub-sequence in (3). I will repeat (3) with the subsequence in red and immediately below align the piano sequence.
| Sequence 5 | |||||||||||||||
| 1 | 2 | 3 | 4 | 5 | 6 | 7 | 8 | ||||||||
| 2 | 1 | 2 | 2 | 1 | 1 | 1 | 2 | ||||||||
| 2 | 1 | 2 | 2 | 1 | 2 | 2 | 2 | 1 | 2 | 2 | 1 | 2 | |||
| A | B | C | D | E | F | G | A | B | C | D | E | F | G | A | |
If the sixth note above is assumed to be a black key and is removed from the matrix-derived sequence, then the sequence becomes
| Sequence 6 | ||||||||||||||
| 1 | 2 | 3 | 4 | 5 | 6 | 7 | 8 | |||||||
| 2 | 1 | 2 | 2 | 1 | 1 | 1 | 2 | |||||||
| 2 | 1 | 2 | 2 | 1 | 2 | 2 | 2 | 1 | 2 | 2 | 1 | 2 | ||
| A | B | C | D | E | F | G | A | B | C | D | E | F | G | A |
and we see we have a match. From Table 2, we see that piano key 'A' corresponds to the normalized frequency of 2.0, the matrix position of which, from Table 1, is (1,1) and thus fnorm(1,1) = 2.0 and is the note A in the C major key, which as I stated before is the only key in which all the notes of the key are non-black, i.e. white.
We have shown that our methodology can be used to derive both the the seven tones of the octave and the 12 tones from which we derive all the musical keys of Western music. In Table 2, where an octave is displayed, the eighth note is the same as the first note, but one octave higher. In contrast, in our 12-tone scale, we have 12 unique tones and it is the 13th tone that is one octave higher than the first tone. For consistency, perhaps we should rename the octave the septave.
Going back to Sequence 4, there is still something additional that we can tease out of the data. The ones in the first row represent the positions on the piano keyboard where there are no black keys between the white keys, i. e. B,C and E,F. The ones can be considered separators and we can count the number of twos between the separators. We can mentally continue the sequence indefinely by realizing that the final A of the sequence is the same as the first A of the sequence. We are now ready to count the number of twos between the separators: 23232323... We thus see the the positions of the white keys not separated by black keys are maximally separated and therefore the black keys also are maximally separated from each other. The key named C could equally well have been named A, B, D, E, F, or G. In our exercise, calling the note C is the consequence of naming the key at position (0,0) in Table 1 an 'A'. This has led me to wonder if I have caught a glimpse into the origins of how the naming of keys originated. This feeling persisted at numerous points during the remainder of this paper. This explains why I included the words "An Archaeological Dig" in the title of this paper.
Table 3 repeats the second octave of Table 2 but with the corresponding notes in a new first column. These notes were determined in sequence 6 above. Table 3 also has an additional five columns to the right similar to the first four columns but it is for the third octave. In Table 3, note that in column 3, two of the values are shown in red. The first ratio is for that of C and D and the second one is for the ratio between E and F. in both cases, there is a single step between the notes indicating there can not be a black note between either of them. The other five white keys all have black keys between them as we see in the table. Remember that in Table 2, there was one too many notes for the eight notes of the octave. There was one additional note which we have identified as an F♯ or G♭. The other four black keys were only generated in the 3rd octave but again one extra note that does not belong was generated. For now, I am calling this note X. In Table 1, we will identify X and an additional four tones.
| Table 3: Generation of Twelve Tones | |||||||||
| note | 2nd Octave fnorm |
Ratio to Previous Value |
Steps | note | 3rd Octave fnorm |
Ratio to Previous Value |
Steps | ||
| A | 2.0000 | 1.125 | 4.0000 | 1.125 | |||||
| A♯ | 4.2140 | 1.0535 | 1 | Black Key | |||||
| B | 2.2500 | 1.125 | 2 | 4.5 | 1.0679 | 1 | |||
| C | 2.3705 | 1.0535 | 1 | 4.7408 | 1.0535 | 1 | |||
| C♯ | 5.0625 | 1.0679 | 1 | Black Key | |||||
| D | 2.6667 | 1.125 | 2 | 5.3333 | 1.0535 | 1 | |||
| D♯ | 5.6817 | 1.0535 | 1 | Black Key | |||||
| E | 3.0000 | 1.125 | 2 | 6.0000 | 1.0679 | 1 | |||
| F | 3.1605 | 1.0535 | 1 | 6.3210 | 1.0535 | 1 | |||
| F♯ | 3.3750 | 1.0679 | 1 | F♯ | 6.7500 | 1.0679 | 1 | Black Key | |
| G | 3.5556 | 1.0535 | 1 | 7.1111 | 1.0535 | 1 | |||
| G♯ | 7.4905 | 1.0535 | 1 | Black Key | |||||
| X | 7.5938 | 1.0136 | |||||||
| A | 4.0000 | 1.125 | 2 | 8.0000 | 1.0535 | 1 | |||
Table 3: Generation of the 12 Tones of Western Music
Note that in the second ratio column of Table 3,, there are two different values: 1.0535 and 1.0679. The significance of these two values will be examined with reference to Table 4. A major difference in Table 4 is that the compared octaves will run from C to an octave higher. The phenomenon we will be examining does not appear until we reach C in the 4th octave. The A♯ near the bottom of the first column of Table 4 is one octave higher than the corresponding A♯ near the top of Table 3.
In column 3 of Table 4, wherever we see a line containing the ratio 1.0679 then for the corresponding fnorm0 in column 2, there will be a 2fnorm0 in column 6 for the 4th octave that appears on the same line of the table. In the line immediately preceding this line, there will a new 4th octave tone with a ratio of 1.0535 for the new tone and a ratio of 1.0135 between the new tone and the 2fnorm0 on the succeeding line. In the equal-tempered scale used on the piano, the single step value is replaced by the 12th root of 2 so that with 12 tones, the 12th power of the 12th root of 2 is of course two. This insures that C♯ is the same tone as D-flat, etc. Without tempering, the flats and sharps no longer coincide and we have now seven white keys, five sharps and five flats. Some organs have been built with separate pipes for the adjacent sharp and flat tones. In Table 3, it was assumed that all the black keys could be described as sharps as is true on the piano. In Table 1, we see that the third octave black keys actually are D♭, D♯, G♭, G♯ and A♯. We have also identified the mysterious X tone of Table 3 that was immediately below G♯. From Table 4, we see it is A♭.
With the four additional tones of C♯, E♭, F♯ and B♭ that are generated in the 4th octave, we now have 17 tones in the octave with a ratio of approximately 1.0136 between the flat-sharp doublets and 1.0535 between all other tones. The single asterisk in the step column, indicates the doublet ratio and the double asterisks the new ratios associated with the unknown B-. Again, we have one tone that shows up prematurely and it will be discussed in Table 5. For reasons that will become apparent, I have labeled this errant tone B- because it appears between B♭ and B. Table 5 will be the final table in this sequence of tables.
| Table 4: When the Sharps Separate From the Flats | ||||||||
| Note | 2nd Octave fnorm | Ratio to Previous Value | Steps | note | 3rd Octave fnorm | Ratio to Previous Value | Steps | |
| C | 4.707 | 1.05035 | C | 9.4815 | 1.0535 | |||
| C♯ | 9.9887 | 1.0535 | 1 | |||||
| D♭ | 5.0625 | 1.0679 | 1 | D♭ | 10.125 | 1.0136 | * | |
| D | 5.3333 | 1.0535 | 1 | D | 10.6667 | 1.0535 | 1 | |
| D♯ | 5.6187 | 1.0535 | 1 | D♯ | 11.2371 | 1.0535 | 1 | |
| E♭ | 11.3906 | 1.0136 | * | |||||
| E | 6.0000 | 1.0679 | 1 | E | 12.0000 | 1.0535 | 1 | |
| F | 6.3210 | 1.0535 | 1 | F | 12.6420 | 1.0535 | 1 | |
| F♯ | 14.9831 | 1.0535 | 1 | |||||
| G♭ | 6.7500 | 1.0679 | 1 | G♭ | 13.500 | 1.0136 | * | |
| G | 7.49915 | 1.0535 | 1 | G | 14.2222 | 1.0535 | 1 | |
| G♯ | 7.4915 | 1.0535 | 1 | G♯ | 14.9831 | 1.0535 | 1 | |
| A♭ | 7.5938 | 1.0136 | * | A♭ | 15.1875 | 1.0136 | * | |
| A | 8.0000 | 1.0535 | 1 | A | 16.0000 | 1.0535 | 1 | |
| A♯ | 8.4280 | 1.0535 | 1 | A♯ | 16.8560 | 1.0535 | 1 | |
| B♭ | 17.0860 | 1.0136 | * | |||||
| B_ | 17.7577 | 1.0393 | ** | |||||
| B | 9.0000 | 1.0679 | 1 | B | 18.0000 | 1.0136 | 1 | |
| C | 9.4815 | 1.0535 | 1 | C | 18.9630 | 1.0535 | 1 | |
Table 4 When the Sharps Separate from the Flats
In Table 4, we observed a mystery tone between B♭ and B. The ratio of its normalized frequency to that of B♭ was a previously unobserved 1.0393. In Tables 2 and 3, we also observed a mysterious interloper which was explained in the following table. In Table 5, we observe the 1.0393 ratio eight times so the pattern is still being followed, but we have not yet determined what these new frequencies represent. Seven tones appears immediately above or below the tones A, B, C, D, E and F. The 1.0393 ratio is always between the new tone and an adjacent sharp or flat and thus never between B and C or E and F, I must defer a very simple explanation for the presence of these eight until some additional concepts have been described.
| Table 5: Twenty-Five Tone Music: Whatever in the World is It? | ||||||||
| No. | Note | fnorm | Ratio to Previous Value |
No. | note | fnorm | Ratio to Previous Value |
|
| 0 | A | 32.0000 | 13 | E_ | 47.3539 | 1.0393 | ||
| 1 | A♯ | 33.7119 | 1.0535 | 14 | E | 48.0000 | 1.0136 | |
| 2 | B♭ | 34.1719 | 1.0136 | 15 | F | 50.5679 | 1.0535 | |
| 3 | B_ | 35.5155 | 1.0393 | 16 | F+ | 51.2578 | 1.0136 | |
| 4 | B♯ | 36.0000 | 1.0136 | 17 | F♯ | 53.2732 | 1.0393 | |
| 5 | C | 37.9259 | 1.0535 | 18 | G♭ | 54.0000 | 1.0136 | |
| 6 | C+ | 38.4434 | 1.0136 | 19 | G_ | 56.1232 | 1.0393 | |
| 7 | C♯ | 39.9549 | 1.0393 | 20 | G | 56.8889 | 1.0136 | |
| 8 | D♭ | 40.0000 | 1.0136 | 21 | G+ | 57.6650 | 1.0136 | |
| 9 | D_ | 42.0924 | 1.0393 | 22 | G♯ | 59.9323 | 1.0393 | |
| 10 | D | 42.6667 | 1.0136 | 23 | A♭ | 60.7500 | 1.0136 | |
| 11 | D♯ | 44.9492 | 1.0535 | 24 | A_ | 63.1386 | 1.0393 | |
| 12 | E♭ | 45.5625 | 1.0136 | 25 | A | 64.0000 | 1.0136 | |
Table 5: Twenty-Five Tone Music: Whatever in the World is It?
Table 6 summaries what we have observed in the previous Tables and also introduces two new column. The second column contains the coordinates of fnorm(m,n) from Table 1. The second column requires a little explanation. In Tables 3, 4 and 5, the tone A always has the value fnorm equal to the powers of 2. Thus fnorm(0.0), which from Table 1 is equal to 1.0, is the fundamental tone for the multiples of A at fnorm equal to 2,4,8... Thus fnorm is relative to A. We now define a new relative frequency Fnorm that is computed relative to the tone C and thus the values of Fnorm are equal to the powers of two, i. e. 1,2,4... We will use this information in a later section of this paper. Column 3 is the location of the tone in Table 1.
| Table 6 Summation of Observation From Previous Tables | ||||||||||||
| fnorm | Fnorm | m,n | Ratio | Steps | Tone Name | fnorm | Fnorm | m,n | Ratio | Steps | Tone Name | |
| 1.00 | 0,0 | A | 18.00 | 7.59 | 3,5 | 1.0136 | 1 | B | ||||
| 1.33 | 1,0 | 1.333 | 5 | D | 18.96 | 8.00 | 6,3 | 1.0535 | 1 | C | ||
| 1.50 | 0,1 | 1.1250 | 2 | E | 19.98 | 8.43 | 9,1 | 1.0535 | 1 | C♯ | ||
| 1.78 | 2,0 | 1.1852 | 3 | G | 20.25 | 8.54 | 2,6 | 1.0136 | 1 | D♭ | ||
| 2.00 | 1,1 | 1.125 | 2 | A | 21.33 | 9.00 | 5,4 | 1.0536 | 1 | D | ||
| 2.25 | 0,2 | 1.125 | 2 | B | 22.47 | 9.48 | 8,2 | 1.0536 | 1 | D♯ | ||
| 2.37 | 1.00 | 3,0 | 1.0535 | 1 | C | 22.78 | 9.61 | 1,7 | 1.0136 | E♭ | ||
| 2.67 | 1.13 | 2,1 | 1.1250 | 2 | D | 23.68 | 9.99 | 11,0 | 1.0393 | E_ | ||
| 3.00 | 1.27 | 1,2 | 1.1250 | 2 | E | 24.00 | 10.13 | 4,5 | 1.0136 | 1 | E | |
| 3.16 | 1.33 | 4,0 | 1.0535 | 1 | F | 25.28 | 10.67 | 7,3 | 1.0535 | 1 | F | |
| 3.38 | 1.42 | 0,3 | 1.0679 | 1 | G♭ | 25.63 | 10.81 | 0,8 | 1.0136 | 1 | F+ | |
| 3.56 | 1.50 | 3,1 | 1.0535 | 1 | G | 26.64 | 11.24 | 10,1 | 1.0393 | 1 | F♯ | |
| 4.00 | 1.69 | 2,2 | 1.1250 | 2 | A | 27.00 | 11.39 | 3,6 | 1.0136 | G♭ | ||
| 4.21 | 1.78 | 5,0 | 1.0535 | 1 | A♯ | 28.44 | 12.00 | 6,4 | 1.0535 | 1 | G | |
| 4.50 | 1.90 | 1,3 | 1.0679 | 1 | B | 29.97 | 12.64 | 9,2 | 1.0535 | 1 | G♯ | |
| 4.74 | 2.00 | 4,1 | 1.0535 | 1 | C | 30.38 | 12.81 | 2,7 | 1.0136 | A♭ | ||
| 5.06 | 2.14 | 0,4 | 1.0679 | 1 | D♭ | 31.57 | 13.32 | 12,0 | 1.0393 | A_ | ||
| 5.33 | 2.25 | 3,2 | 1.0535 | 1 | D | 32.00 | 13.50 | 5,5 | 1.0136 | 1 | A | |
| 5.62 | 2.37 | 6,0 | 1.0535 | 1 | D♯ | 33.71 | 14.22 | 8,3 | 1.0535 | 1 | A♯ | |
| 6.00 | 2.53 | 2,3 | 1.0679 | 1 | E | 34.17 | 14.42 | 1,8 | 1.0136 | B♭ | ||
| 6.32 | 2.67 | 5,1 | 1.0535 | 1 | F | 35.52 | 14.98 | 11,1 | 1.0393 | B_ | ||
| 6.75 | 2.85 | 1,4 | 1.0679 | 1 | G♭ | 36.00 | 15.19 | 4,6 | 1.0136 | 1 | B | |
| 7.11 | 3.00 | 4,2 | 1.0535 | 1 | G | 37.93 | 16.00 | 7,4 | 1.0535 | 1 | C | |
| 7.49 | 3.16 | 7,0 | 1.0535 | 1 | G♯ | 38.44 | 16.22 | 0,9 | 1.0136 | C+ | ||
| 7.59 | 3.20 | 0,5 | 1.0136 | A♭ | 39.95 | 16.86 | 10,2 | 1.0393 | 1 | C♯ | ||
| 8.00 | 3.38 | 3,3 | 1.0535 | 1 | A | 40.50 | 17.09 | 3,7 | 1.0136 | D♭ | ||
| 8.43 | 3.56 | 6,1 | 1.0535 | 1 | A♯ | 42.09 | 17.76 | 13,0 | 1.0393 | D_ | ||
| 9.00 | 3.80 | 2,4 | 1.0679 | 1 | B | 42.67 | 18.00 | 6,5 | 1.0136 | 1 | D | |
| 9.48 | 4.00 | 5,2 | 1.0535 | 1 | C | 44.95 | 18.96 | 9,3 | 1.0535 | 1 | D♯ | |
| 9.99 | 4.21 | 8,0 | 1.0535 | 1 | C♯ | 45.56 | 19.22 | 2,8 | 1.0136 | E♭ | ||
| 10.13 | 4.27 | 1,5 | 1.0136 | D♭ | 47.35 | 19.98 | 12,1 | 1.0393 | E_ | |||
| 10.67 | 4.50 | 4,3 | 1.0535 | 1 | D | 48.00 | 20.25 | 5,6 | 1.0136 | 1 | E | |
| 11.24 | 4.74 | 7,1 | 1.0535 | 1 | D♯ | 50.57 | 21.33 | 8,4 | 1.0535 | 1 | F | |
| 11.39 | 4.81 | 0,6 | 1.0136 | E♭ | 51.26 | 21.62 | 1,9 | 1.0136 | F+ | |||
| 12.00 | 5.06 | 3,4 | 1.0535 | 1 | E | 53.27 | 22.47 | 11,2 | 1.0393 | 1 | F♯ | |
| 12.64 | 5.33 | 6,2 | 1.0535 | 1 | F | 54.00 | 22.78 | 4,7 | 1.0136 | 1 | G♭ | |
| 13.32 | 5.62 | 9,0 | 1.0535 | 1 | F♯ | 56.12 | 23.68 | 14,0 | 1.0393 | 1 | G_ | |
| 13.50 | 5.70 | 2,5 | 1.0136 | G♭ | 56.89 | 24.00 | 7,5 | 1.0136 | 1 | G | ||
| 14.22 | 6.00 | 5,3 | 1.0535 | 1 | G | 57.67 | 24.33 | 0,10 | 1.0136 | 1 | G+ | |
| 14.98 | 6.32 | 8,1 | 1.0535 | 1 | G♯ | 59.93 | 25.28 | 10,3 | 1.0393 | 1 | G♯ | |
| 15.19 | 6.41 | 1,6 | 1.0136 | A♭ | 60.75 | 25.63 | 3,8 | 1.0136 | 1 | A♭ | ||
| 16.00 | 6.75 | 4,4 | 1.0535 | 1 | A | 63.14 | 26.64 | 13,1 | 1.0393 | A_ | ||
| 16.86 | 7.11 | 7,2 | 1.0535 | 1 | A♯ | 64.00 | 27.00 | 6,6 | 1.0136 | 1 | A | |
| 17.76 | 7.49 | 10,0 | 1.0393 | B_ | ||||||||
Table 6: Summation of Observation From Previous Tables.
Now is an opportune moment to make clear that a half-tone step refers to the 12 tones of Western music. In Tables 2 and 3, the ratio for a single step was either 1.0679 or 1.0595. In Table 4, we see all the 1.0535 become the standard half tone with 1.0136 being the ratio of the flat/sharp doublet. Performing the division 1.0679/1.0595 we get the approximate value 1.0136.
In a later section, we will discover that these values are each the ratio of two integers. In Table 5, the 1.0393 ratio is associated with the additional tones that do not appear to be related to any musical system . Finding them demonstrated that we had already gone as far as we could usefully go. Again, 1.0535 / 1.0136 equals 1.03936 where 1.03936 also approximates the ratio of two integers. A step value of 1 only appears when the tone name is one of the 12 tones. For example, consider the value of fnorm equal to 37.93. The ratios on the lines that follow through the D♭ line result in the multiplication
| (1.0136) | (1.0393) | (1.0136) = | 1.0679 | (7) |
| C+ | C♯ | D♭ | ||
| (1.0136) | (1.0393) = | 1.0595 | ||
| C+ | C♯ |
First, we need to start off with a small digression on what makes hearing two tones played together sound either harmonious or dissonant. Lets start with some fundamental frequency f0. A harmonic series is of the form f0, 2f0, 3f0, 4f0, 5f0 , 6f0 .... Let's assume that f0 is normalized to 1.0. We then get the normalized frequencies 1, 2, 3, 4, 5, 6... If we combine the third and second harmonics, the ratio between them is three/halves. Let's assume that f0 is the note A. Then the normalized frequency of 2.0 is also A and from Table 3, the value of 3.0 is E. The chord AE is called a perfect fifth because the sequence A B C D E is of length five. We can count the number of semi-tones separating the two tones: A♯ B C C♯ D D♯ E and we get a count of seven for the number of semitones separating the two tones of a perfect fifth. The fourth and third harmonics yield a ratio of 4/3 and the chords AD and EA' with the prime indicating that the A is in the octave above the E. Note that the perfect fifth, AE, combined with the perfect fourth, EA' span an octave from A to A'. This one reason that only the fourth and fifth chords are labeled 'perfect'. A third chord of future interest is formed of the sixth and fifth harmonics and is called a major third with a separation of four semitones. CE is an example of a major third.
There is a whole different way of looking at the sorted values of fnorm in Table 6. We will use a graph structure and each node of the tree will represent some value of fnorm((m.n). At each node there will be two descending vectors, one angling to the left and one angling to the right.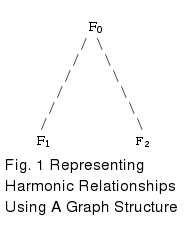
Figure 1 shows the basic element from which the graph is constructed of the graph by being replicated at each node going downward from the top node of F0 in Figure 1. The left-descending tone at F1 will have a frequency of (4/3) F0. The two tones played together as a chord will form a perfect fourth. The right-descending tone at F2 will have a frequency of (3/2)F0. The two tones played together as a chord will form a perfect fifth.
From the first line of Table 6, let
F0 = f(0,0) = (110 hz) fnorm(0,0) = 110 hz,
then F1 = 110(4/3) = 147 hz and F2 = 165 hz and from Table 6 F1 is a D and F2 is an E. From the first line of Table 6, let
F0 = f(0,0) = (110 hz) fnorm(0,0) = 110 hz,
then F1 = 110(4/3) = 147 hz and F2 = 165 hz and from Table 6, F1 is a D and F2 is an E. A and D played together as a chord yields a perfect fourth and A and E played together yields a perfect fifth.
Now we are ready to see how it all plays together. In Fig. 2, we have assembled a large structure with the A tone with a frequency of 110 hz at the top. For simplicity, we sometimes leave the frequency off and show only the the letter that represents any of the 12 tones. From Table 6, we see that (4/3) F1 = (4/3)2 = 1.78 and is a G. The right descending edge from D at F2 = (4/3)(3/2) = 2 and we have an A' from Table 6 (where the prime indicates the ascent of one octave). (Figure. 2) shows the expansion of Fig. 1 that I have just described.
The first thing to observe is that the two descendants (D and E) of A at the top converge at A', one octave down from the top. The ADA' path results with (4/3)(3/2) = 2 and the AEA' path results with (3/2)(4/3) = 2. From the viewpoint of graph theory, what we have is a network, not a tree because there are at least two paths to get between two nodes. The most interesting result are the tones shown in red. They are the C major scale. The two vertical lines enclose the space within which the notes of the scale will appear. We can put any tone of the 12 tones we derived in Table 3 and generate one of the 12 scales, but as we see in Figure 2, putting an A at the top does not yield A major but C major. For example, replacing the A at the top of Fig. 2 with an E will result in the notes of C major being replaced with the notes of G major. The same pattern holds true for the other 11 scales. Now we can ask, what is the relationship between Fig. 2 and Table 1. Fig. 2 was derived from the sorted list of of Table 6. To answer this question, let's first attach a tone name to each frequency that we have identified and then map the tones of Fig. 2 onto this new Table 7. We will color the mapped tones red. The C major keys marked in red on Figure 2 will be marked in green for tones on the first line and blue for tones on the second line.
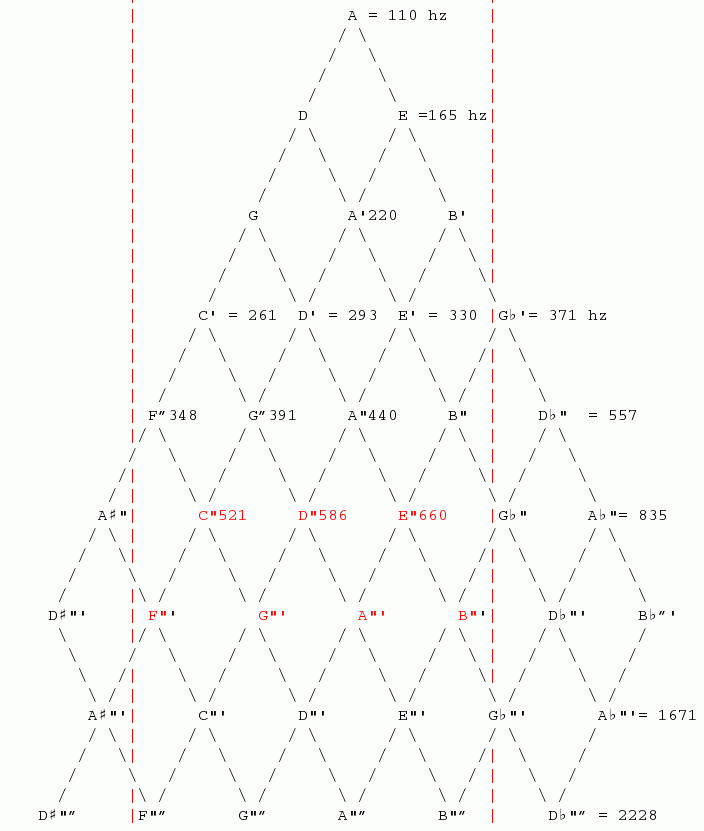
Fig. 2: Graph Demonstrating Harmonic Relationships Between Tones. A Line Descending to the Left Indicates a 4/3 Relationship (A perfect fourth) and a Line Descending to the Right Indicates a 3/2 Relationship (A perfect fifth). A Single Prime attached to a Letter indicates it is one Octave above the Original Octave of F(0,0). A Double Primes indicates two Octaves and so forth. The Notes in Red Demonstrate How the Notes of C major Align themselves. All 12 of the major scales will be positioned in the same Fashion between the two vertical lines.
Tables 7A and 7B summarize everything we have learned so far. First, we can observe that all the tones we have explored in the previous tables can all be found either in the top row or the left-most column. All the sharps are the furtherest down of the tones on column 0. Similarly, the flats are the furtherest to the right on row 0. In the equal-tempered system the adjacent sharp-flat doublets are pushed together to form a single tone represented by the black keys on the piano. Harmonically, they are very far apart but the ratio of the normalized frequencies is a very small 1.0136.
| Table 7a: Matrix of Powers of Four-thirds and Three-halves with Corresponding Tones | ||||||||||||
| 0 | 1 | 2 | 3 | 4 | 5 | |||||||
| 0 | 1.00 | A | 1.50 | E | 2.25 | B | 3.38 | G♭ |
5.06 | D♭ | 7.59 | A♭ |
| 1 | 1.33 | D | 2.00 | A | 3.00 | E | 4.5 | B | 6.75 | G♭ | 10.1 | D♭ |
| 2 | 1.78 | G | 2.67 | D | 4.00 | A | 6.00 | E | 9.0 | B | 13.5 | G♭ |
| 3 | 2.37 | C | 3.56 | G | 5.33 | D | 8.00 | A | 12.0 | E | 18.0 | B |
| 4 | 3.16 | F | 4.74 | C | 7.11 | G | 10.67 | D | 16.0 | A | 24.0 | E |
| 5 | 4.21 | A♯ | 6.32 | F | 9.48 | C | 14.2 | G | 21.3 | D | 32.0 | A |
| 6 | 5.62 | D♯ | 8.43 | A♯ | 12.6 | F | 19.0 | C | 28.4 | G | 42.7 | D |
| 7 | 7.49 | G♯ | 11.2 | D♯ | 16.9 | A♯ | 25.3 | F | 37.9 | C | 56.9 | G |
| 8 | 9.99 | C♯ | 15.0 | G♯ | 22.5 | D♯ | 33.7 | A♯ | 50.6 | F | 75.9 | C |
| 9 | 13.3 | F♯ | 20.0 | C♯ | 30.0 | G♯ | 44.9 | D♯ | 67.4 | A♯ | 101 | F |
| 10 | 17.8 | B_ | 26.6 | F♯ | 40.0 | C♯ | 59.9 | G♯ | 89.9 | D♯ | 135 | A♯ |
| 11 | 23.7 | E_ | 35.5 | B_ | 53.3 | F♯ | 79.9 | C♯ | 120 | G♯ | 180 | D♯ |
| 12 | 31.6 | A_ | 47.4 | E_ | 71.0 | B_ | 107 | F♯ | 160 | C♯ | 2400 | G♯ |
| 13 | 42.1 | D_ | 63.1 | A_ | 94.7 | E_ | 142 | B_ | 213 | F♯ | 320 | C♯ |
| 14 | 56.1 | G_ | 84.2 | D_ | 126 | A_ | 189 | E_ | 284 | B_ | 426 | F♯ |
| 15 | 74.8 | 112 | G_ | 168 | D_ | 253 | A_ | 379 | E_ | 568 | B_ | |
| 16 | 99.8 | 150 | 224 | G_ | 337 | D_ | 505 | A_ | 758 | E_ | ||
| 17 | 133 | 200 | 299 | 449 | G_ | 673 | D_ | 1010 | A_ | |||
| 18 | 177 | 266 | 399 | 599 | 898 | G_ | 1347 | D_ | ||||
| 19 | 237 | 355 | 532 | 798 | 1197 | 1796 | G_ | |||||
| 20 | 315 | 473 | 710 | 1064 | 1596 | 2395 | ||||||
Table 7: Matrix of Powers of Four-thirds and Three-halves with Corresponding Tones. The blue and green entries above can be read along first the green diagonal and then the blue diagonal to select the seven normalized frequencies that make up an octave on the diatonic scale. Normalized frequencies increase in the vertical direction by powers of four-thirds and by three-halves in the horizontal direction.
| 6 | 7 | 8 | 9 | 10 | 11 | 12 | ||||||||
| 0 | 11.4 | E♭ | 17.1 | B♭ | 25.6 | F+ | 38.4 | C+ | 57.7 | 86.5 | 130 | |||
| 1 | 15.2 | A♭ | 22.8 | E♭ | 34.2 | B♭ | 51.3 | F+ | 76.9 | C+ | 115 | 173 | ||
| 2 | 20.3 | D♭ | 30.4 | A♭ | 45.6 | E♭ | 68.3 | B♭ | 103 | F+ | 154 | C+ | 231 | |
| 3 | 27.0 | G♭ | 40.5 | D♭ | 60.8 | A♭ | 91.1 | E♭ | 137 | B♭ | 205 | F+ | 308 | C+ |
| 4 | 36.0 | B | 54.0 | G♭ | 81.0 | D♭ | 122 | A♭ | 182 | E♭ | 273 | B♭ | 410 | F+ |
| 5 | 48.0 | E | 72.0 | B | 108 | G♭ | 162 | D♭ | 243 | A♭ | 365 | E♭ | 547 | B♭ |
| 6 | 64.0 | A | 96.0 | E | 144 | B | 216 | G♭ | 324 | D♭ | 486 | A♭ | 729 | E♭ |
| 7 | 85.3 | D | 128 | A | 192 | E | 288 | B | 432 | G♭ | 648 | D♭ | 972 | A♭ |
| 8 | 114 | G | 171 | D | 256 | A | 384 | E | 576 | B | 864 | G♭ | 1296 | D♭ |
| 9 | 152 | C | 228 | G | 341 | D | 512 | A | 768 | E | 1152 | B | 1728 | G♭ |
| 10 | 202 | F | 303 | C | 455 | G | 683 | D | 1024 | A | 1536 | E | 2304 | B |
| 11 | 270 | A♯ | 405 | F | 607 | C | 910 | G | 1365 | D | 2048 | A | 3072 | E |
| 12 | 360 | D♯ | 539 | A♯ | 809 | F | 1214 | C | 1820 | G | 2731 | D | 4096 | A |
| 13 | 479 | G♯ | 719 | D♯ | 1079 | A♯ | 1618 | F | 2427 | C | 3641 | G | 5461 | D |
| 14 | 639 | C♯ | 959 | G♯ | 1438 | D♯ | 2158 | A♯ | 3236 | F | 4855 | C | 7282 | G |
| 15 | 852 | F♯ | 1279 | C♯ | 1918 | G♯ | 2877 | D♯ | 4315 | A♯ | 6473 | F | 9709 | C |
| 16 | 1136 | B_ | 1705 | F♯ | 2557 | C♯ | 3836 | G♯ | 5754 | D♯ | 8630 | A♯ | 12945 | F |
| 17 | 1515 | E_ | 2273 | B_ | 3409 | F♯ | 5114 | C♯ | 7671 | G♯ | 11507 | D♯ | 17261 | A♯ |
| 18 | 2020 | A_ | 3031 | E_ | 4546 | B_ | 6819 | F♯ | 10228 | C♯ | 15343 | G♯ | 23014 | D♯ |
| 19 | 2694 | D_ | 4041 | A_ | 6061 | E_ | 9092 | B_ | 13638 | F♯ | 20457 | C♯ | 30685 | G♯ |
| 20 | 3592 | G_ | 5388 | D_ | 8082 | A_ | 12123 | E_ | 18184 | B_ | 27276 | F♯ | 40914 | C♯ |
Table 7b: Continuation of Columns 6 through 12 of Table 7a.
From Table 7, we can determine the precise ratios of the constants that we have
seen approximated in all the tables. Let's try a simple case first. What is
the ratio between G and F. G has coordinates of (2,0) and F has coordinates of
(4,0). The answer is obviously
(4/3)4-2 (3/2)0-0 = 16/9 >br>
For points at (a, b) and (c, d), we have the ratio
| R12 = (4/3)c-a (3/2)d-b | (8) |
Now let's apply eq. 8 to the ratio between tones a half-tone apart. If we select B and C, we will have coordinates (0,2) and (3,0). We want the larger number on top or we get get a ratio less than one. If so, we can just take the reciprocal to get the correct answer. Proceeding we get
R12 = (4/3)3 (3/2)-2 = (4/3)3(2/3)2 = 28/35 = 256/243 ~= 1.05349794238683.
From Table 6, we know that the ratio between C and D is 1.125. Let's derive it again using eq. 8. C has coordinates of (3,0) and D has coordinates of (2,1) and thus R12 = (4/3)3-2 (3/2)-1 = (4/3) (2/3) = 8/9 and taking the reciprocal we get 9/8 = 1.125. Now let's compute the ratio of an adjacent sharp/flat doublet. We can take G♯ at (7,0) and A♭ at (0,5) and we get (4/3)-7 (3/2)5 = (3/4)7 (3/2)5 = 312/ 219 = 531441/524288 ~= 1.01364326477051. We will be encountering this number later. It was first discovered in a different context over 2000 years ago.
We have one more constant that we have encountered in the tables. Just to be complete, let's compute it too. We can choose B_ and B♭ from Table 6. the coordinates are (11,1) and (1, 8) and we get (4/3)10(3/2)1-8 = (4/3)10/(2/3)7 = 227/317 = 129140163/ 134217728 ~= 1/1.03931824834386.
Now, let's look at Table 7 in a different way. In Table 7, traversing downward in the table yields increasing values so we can consider the downward y-axis to be positive. Figure. 2 also shares this positive downward axis. Let's now measure angles with respect to this y-axis with the counter-clockwise direction considered positive. In Table 7A, vertical descent (i. e. at an angle of zero degrees) yields increasing powers of (4/3) while the same result occurs at roughly minus 30 degrees in Figure 2. Similarly, in Table 7A, traversal to the right (i. e. 90 degrees) yields increasing powers of (3/2) while the same result occurs at roughly 30 degrees in Fig. 2. If we rotate Table 7A by 45 degrees in the clockwise direction, we can see the similarity of the Figure 2 and Table 7A. By enlarging the number of nodes in Figure 2, all the cells of Figure 7 could be mapped into the nodes of Fig. 2. A key concept is that the checkerboard pattern of Figure 3 is a direct analog of the diamond pattern of Figure 2. In both figures, connectivity is along the diagonals. Thus the graph of Figure 2 is simply another way to observe the same data. The notes of the C major key are easily visible in Fig. 2 but are likely to be missed in Table 7 unless one already knows where to look.
We could draw eleven more graphs similar to Figure 2 with a different tone at the top of each graph and with a different musical scale marked in red similar marking of the scale on Fig. 2. But we don't have to! Instead we can put Figure 2 into a little different form and then considerably expanded its range of values. We will now be able to see all such graphs are a subset of the graph represented by the table of Figure 3. The connectivity of the graph is not explicitly shown and is along the diagonals rather than vertically as in Table 7. The nodes of Fig. 2 map directly into the nodes of Fig. 3. The advantage of this representation of the graph is that we can expand its range to cover all the tones of Table 7 and be able to quickly determine the coordinates of any node. The table form of the graph also allows a simpler coordinate system than for Fig. 2. In Fig. 3, the coordinates (0,0) are at the location of A on the top row.
In Table 7. the coordinates of the corner of the table are (0,0). In Figure 2, we saw that an A at the top of the graph causes the scale of C major to be displayed three levels down. The coordinates in this graph are different than for Fig. 3 so let's examine the coordinate position of the top-most C. Relative to A, which has coordinates of (0,0), the coordinates of this C are (-3,-3). Next consider a graph with a B at the top. It's notes (including the five doublets) are located along the uppermost diagonals. This is why there are 17 columns in the table.
Let's look at a simpler way to extract the scales. We don't need to select the B note and then look for the relative coordinate (-3,-3) and find D. We can simply look for a D sufficiently far down in the D column of the graph that we will be able to extract the seven tones. In the last paragraph, we went down to the third D in the column of D's, but the second D will work just as well. There is one complicating factor: extracting a key with a sharp or flat note. For example, the fourth note of F♯ is off the chart and we get the sequence F♯, G♯, A♯, X, C♯, D♯, and F. X is the unknown note that is off the table. The doublet note of F♯ is G♭. The resulting key is G♭, A♭, B♭, B, D♭, Eb and Y where Y is off the table. This is the one case where neither one of the doublet pair yields a complete key, but the equal-tempered key can be represented by the sequence F♯, G♯, A♯, B, C♯, D♯, F and also by the equivalent sequence G♭, A♭, B♭, B, D♭, E♯, F.
Of the other four doublet pairs, C♯ is okay while D♭ is missing two tones, G♯ is okay while A♭ is missing three tones, D♯ is okay while E♭ is missing four tones, and A♯ is okay while B♭ is missing five tones. Thus we see that none of the flats yields a complete scale and neither does F♯. Again using Fig. 3, the A, B, C, D, E, F and G scales are all easily seen to be complete. We have now accounted for eleven untempered scales compared to the twelve tempered scales.
When I started writing this paper I had never heard of the Cycle of Fifths or the related Pythagorean Comma. My efforts collided with the Pythagorean Comma in a rather strange way. The Pythagorean Comma is defined as the value of
| (3/2)12/27 = 312/219 = 531441/524288 ~= 1.01364326477051. | (9) |
This is precisely the same constant that has appeared in Tables 3 through 7 and most commonly appeared as the ratio between sharp/flat doublets that are merged together in a tempered scale. A common way of tuning instruments has been to repeatedly increase the pitch by a factor of three-halves until the total reached twelve. The cycle of multiplying by three-halves twelve times is thus this same Cycle of Fifths. This new frequency is almost, but not quite, seven octaves higher than the original pitch and thus we get the value in eq. 9.
| Figure 3: The Graph of Figure 2 Reformatted into a Table and Expanded | ||||||||||||||||
| 0 | 1 | 2 | 3 | 4 | 5 | 6 | 7 | 8 | 9 | 10 | 11 | 12 | 13 | 14 | 15 | 16 |
A | ||||||||||||||||
| D | E | |||||||||||||||
| G | A | B | ||||||||||||||
| C | D | E | G♭ | |||||||||||||
| F | G | A | B | D♭ | ||||||||||||
| A♯ | C | D | E | G♭ | A♭ | |||||||||||
| D♯ | F | G | A | B | D♭ | E♭ | ||||||||||
| G♯ | A♯ | C | D | E | G♭ | A♭ | B♭ | |||||||||
| C♯ | D♯ | F | G | A | B | D♭ | E♭ | |||||||||
| F♯ | G♯ | A♯ | C | D | E | G♭ | A♭ | B♭ | ||||||||
| C♯ | D♯ | F | G | A | B | D♭ | E♭ | |||||||||
| F♯ | G♯ | A♯ | C | D | E | G♭ | A♭ | B♭ | ||||||||
| C♯ | D♯ | F | G | A | B | D♭ | E♭ | |||||||||
| F♯ | G♯ | A♯ | C | D | E | G♭ | A♭ | B♭ | ||||||||
| C♯ | D♯ | F | G | A | B | D♭ | E♭ | |||||||||
| F♯ | G♯ | A♯ | C | D | E | G♭ | A♭ | B♭ | ||||||||
| C♯ | D♯ | F | G | A | B | D♭ | E♭ | |||||||||
| F♯ | G♯ | A♯ | C | D | E | G♭ | A♭ | B♭ | ||||||||
| C♯ | D♯ | F | A | B | D♭ | E♭ | ||||||||||
| F♯ | G♯ | A♯ | E | G♭ | A♭ | B♭ | ||||||||||
| C♯ | D♯ | B | D♭ | E♭ | ||||||||||||
| F♯ | G♯ | G♭ | A♭ | B♭ | ||||||||||||
| C♯ | D♭ | E♭ | ||||||||||||||
| F♯ | A♭ | B♭ | ||||||||||||||
| E♭ | ||||||||||||||||
| B♭ | ||||||||||||||||
Figure 3: The Graph of (Figure. 2) Reformated into the Table Above. Connectivity Remains Along the Diagonals; Not Vertically or Horizontally.
We can observe the Cycle of Fifths in Figure 3 by looking at the diagonal between the uppermost F♯ and the lowest B♭. This diagonal contains a total of 16 multiplications by three-halves. In this diagonal, there are a total of five Cycles of fifths.. Dividing the ratio of the frequency for F♯ and the frequency of D♭ in Table 7 by 128 yields the value 1.01364326477051 as before. This calculation was also repeated for every line in Table 7 and this constant was always obtained. However, only the rows 5 through 9 in Table 7 have valid musical notes in both columns 0 and 12.
In each of the columns 3 through 12, we can see a sequence of twelve perfect fourths made up of notes from the the 17 notes of Table 4. In Table 7, the ratio of values in the 12th row of a column divided by the value in the zeroth row of the same column equals about 31.56929. Let's try the the twelve power of 4/3 divided by five octaves and compare against eq. 9:
(4/3)12/25 = 219/312 = 27 / (3/2)12 = 1/ 1.01364326477051 = 1/P
and we see we have what might be called a corresponding cycle of fourths with 1/P replacing P.
I promised an explanation for the eight additional tones generated in Table 5. From Table 7, we see that the chord BG♭ is a perfect fifth. Therefore, G♭/B = 3/2. Let the Pythagorean Comma be represented by P. From Table 5, we see that B/B_ = P. Also from Table 5, G♭/F♯ = P. Combining these three equations , we get
3/2 = G♭/B = (PF♯)/ (PB_) = F♯/B_
Thus B_ F♯ is also a perfect fifth. We can see what is happening in seq. 11 by looking at the first 12 entries of column 2 of Table 7. We see the pattern BEADGCFA♯DA♯GA♯CA♯FA♯B-. Here we see a complete cycle of fourths. Recall that B/B- = P. Thus we see the start of the same pattern with minuses attached to each note. If we had computed an additional four or five octaves, we would have generated a string of twelve fourths from B- out to F♯- and to B--.
Similarly the equations F/A♯ = 3/2, F+/F = P and B♭/A♯ = P can be combined to get F/A♯ = F+/B♭ = 3/2. In row 4 of Table 7, we have a cycle of fifths starting with G in column 0 and concluding with B♭F+. In accordance with eq. 9, F in column 0, becomes F+ in column 12. In columns 8-12 of row 0 we have the sequence F+ C+ D+ D+ A+ which mirrors F C G D A of columns 0-4 of row 4.
We've now shown how the Pythagorean Comma ties together the sharp/flat doublet, the cycle of fifths and what we might call a cycle of fourths. A cycle of perfect fifths starting with BG♭ progresses to B♭F+ and undoubtedly out to B♭+F++. Furthermore the perfect fourth F♯B- is the gateway to the progression of perfect fourths to B- and to F♯-.
We are now ready for the really great simplification! With just two rows from Fig. 3, we can extract any of the eleven keys and the cycle of fifths as well as the reverse sequence of fourths. For example, C major is CDE from the second row and FGAB from the first row since there is no third row. The first row is identical to what would be the third row if it had been copied. It wasn't, since it is redundant with what is already in the table. Another example: the key C♯ is C♯ D♯ F F♯ G♯ A♯ C. It is important to remember that with 17 tones, we will often have a different member of the flat/sharp doublet in the sequence than is seen in the standard musical notation where the sharp and flat have been tempered into the same note.
In a zigzag pattern, we can extract a sequence of 16 fifths, reading from left to right in Table 8:
| F♯ C♯ G♯ D♯A♯ F C G D A E B G♭ D♭ A♭ Eb B♭ | (10) |
Previously, we have observed that the downward diagonal from left to right in Fig. 3 will produce a combined ratio of (3/2)n. Let this path be for the notes F C G D and let the corresponding values of fnorm be represented by the actual notes. Then C/F = 3/2, G/C = 3/2 and D/G =3/2. Suppose that instead of continuing downward from C to G, that the path changes direction to go up and right to the node directly above G, This node, G' is one octave lower in value and is equal to G/2. Thus G' divided by C equals 3/4. The sequence of the zigzag pattern of Table 8 is thus
| (3/4)(3/2)(3/4)(3/2)(3/4)(3/2)(3/4)(3/2)(3/4)(3/2)(3/4)(3/2)... | ((11) |
This sequence simply has a normalization of the form that is done to keep normalized frequencies between one and two. Also, three-fourths is the reciprocal of four-thirds and is thus normalized to three/halves. Therefore the musical chord of, for example, F♯ and C♯' is a fourth, not a fifth. The musical chord of F♯ and C♯ is a fifth.
If we account for the normalization that occurs on alternate nodes of the zigzag path we can compute the Pythagorean Comma from Table 8. Using sequence 11, we can do precisely that. The odd columns already a include a division by two. Thus the accumulative ratio of 2.03, shown in column 12 of the bottom row of Table 8, has had six such divisions by two. More precisely the value is 2.02728652954102. If we divide this number one more time by two we will obtain 1.01364326477051 which is exactly the Pythagorean Comma of (3/2)12 / 27.
| Table 8: Super Rows | ||||||||||||||||
| 0 | 1 | 2 | 3 | 4 | 5 | 6 | 7 | 8 | 9 | 10 | 11 | 12 | 13 | 14 | 15 | 16 |
| C♯' | D♯' | F' | G' | A' | B' | D♭' | E♭' | |||||||||
| F♯ | G♯ | A♯ | C | D | E | G♭ | A♭ | B♭ | ||||||||
| 1 | 3/4 | 3/2 | 3/4 | 3/2 | 3/4 | 3/2 | 3/4 | 3/2 | 3/4 | 3/2 | 3/4 | 3/2 | 3/4 | 3/2 | 3/4 | 3/2 |
| 1.0 | .750 | 1.125 | .844 | 1.27 | .950 | .142 | 1.07 | 1.60 | 1.20 | 1.80 | 1.35 | 2.03 | 1.52 | 2.28 | 1.71 | 2.57 |
Table 8. Two rows extracted from Figure 3 from which the eleven untempered scales can be derived followed by a row with the ratios of Sequence 11. the primes indicate a traversal to a lower frequency relative to the previous column. The final row is the accumulative multiplications of the ratios in the previous row.
Let's examine the zigzag pattern of CG'DA'EB' in columns 5 through 11 of Table 8. In Table 8, as well as in Fig. 3, nodes which are connected along a positive slope have a four-thirds or a reciprocal three-quarters relationship. An example from Table 8 is CG'. An F'C has a negative slope connectivity and thus has a three-halves relationship. From F' to C, we advance seven semi-tones beyond F' (i. e. a fifth) and from C to G', we retreat five semi-tones back from C (i. e. a fourth), thus from F in column 5 to G in column 7. From the F♯ of Column 0, we advance one full tone for every two columns and at column 12, we have a G♭, which on a equal-tempered piano is exactly one octave above our starting point of F♯, since F♯ and G♭ merge together under equal-tempered tuning. If on the eleventh column, the path had continued in the positive direction and thereby having an additional division by two, we would have directly computed the Pythagorean comma and would have ended up having started with F♯ and ended up with G♭. We can conclude that a 12 step Cycle of Fifths is actually five fifths in the increasing frequency direction and seven fourths traveling back in the decreasing frequency direction so that the end point is separated from the starting point just by the Pythagorean Comma.
Before we leave this section, let's see if we can figure out why our procedure for deriving each of the twelve keys or scales works. But before we start, we need to review several things: first, that in the horizontal direction, adjacent cells cells have a separation of only a single step and second, that from Sequence 4, the pattern of the number of step within a key is 2212221. with the first "2" indicating the number of steps between C and D and the last "1" indicating the number of steps between B and C. All the keys follow this pattern. This sequence of steps could be called a separation sequence. Our final review item deals with perfect fourths, The fourth note for any of the twelve scales must form a perfect fourth with the first note of the scale. Now remember that a perfect fourth spans five steps. Perfect fourths can be represented, for example, by the pattern CDEF where the chord CF spans five steps. However, FGAB is not a perfect fourth because it spans six steps. Now, going back to our example of C major, We have the initial pattern of CDE which matches the start of the sequence of separations with 22. If we continued with the fourth note of Table six, we would have the pattern CDEG♭ which would have a span of six and so it is not a perfect fourth. Now, how can we extract a perfect fourth to the note C from Table 4? For Figure 3, the rule was introduced that in traveling downward on a negative-slope diagonal that we would encounter perfect fifths. Traveling upward on the same diagonal, we would get the complementary perfect fourths . Thus in Table 4, which was extracted from Fig. 3, we see that FC is a perfect fifth and CF is the required perfect fourth. We now have the sequence of CDEF with the separation sequence of 221. We now need three more notes with a separation of two which we get by reading off GAB, done by looking to the right of F in Table 4. We now have the full octave. Now let's consider G major, which is in the upper row of notes. As before we get GAB and GC is a perfect fourth, since it is downward on the positive-slope diagonal. The next three notes of the scale are then read from to the right of C. We can now see the justification for this procedure for initial starting points on either row of notes.
When Table 6 was first introduced in the previous section, I inserted an additional column, Fnorm which was computed relative to C rather than to A. With the frequencies relative to A, we could observe notes that have ratios of 3/2 and 4/3 to A. With the column with values relative to C, we can finally see the musical serpent that has been lurking in the grass. In Table 6, we see that the values of Fnorm for E, A and B are respectively 1.27, 1.69 and 1.90. The value for E appears to be almost 1.25 or 5/4. How bad is this error in frequency. It was bad enough that during the Medieval Period when Pythagorean tuning was used, the chord of CE was avoided because it sounded dissonant. The ratio of 1.27 to 1.25 is approximately 1.0125. I am now going to introduce a new way to measure ratios between tones. It is
| cents =1200Log2(F1/F2) | (12) |
When the ratio F1 /F2 is equal to two, the log function is equal to one and cents has value of 1200. Since there are twelve semi-tones in an octave, one semi-tone has 100 cents. In the calculations that follow, more accurate values for the tones have been computed using the associated (m.n) of Table 6 in eq. 1. Thus, 1.2625 rather than the 1.27 of Table 6. The ratio of 1.2656 to 1.25 for E yields 21.6063 cents, a fifth of a semi-tone. For A, the ratio is 1.6875 to 5/3 which, surprisingly, again yields 21.6063 cents. Similarly, for B the ratio is 1.8984 to 15/8 and again we get 21.6063. We now see that three of the seven keys in the octave are seriously out of tune.
In the Second Century AD,the Greek-Egyptian astronomer Claudius Ptolemy also studied musical tuning. He was aware of some of the problems with Pythagorean Tuning. His main contribution was an insistence that tuning ratios be of the form (n+1)/n. Using this approach, his scale included 5/4 and 6/5 which improved on the Pythagorean Tuning. There is dispute among modern authors over whether Ptolemy computed ratios between the first note of the scale and each subsequent note of the scale or the ratios were applied between each of the adjacent notes. I have found only one author (Hardegree, ref. 10) who assumes that Ptolemy computed the ratios between adjacent notes to derive his scale. However, it is the paper that I am going to cover, since it actually yields what is known as Just Tuning, which will be discussed shortly. Whether Ptolemy actually used this approach, I will leave to others. Following Hardegree, (3/2) = (5/4)(6/5) and (3/2) =(9/8)(4/3) and finally (4/3) = (9/8)(10/9)(16/15). Note that in every case, the fractions are in the form of (n+1)/n. Below is a table which uses these ratios to construct a scale in which we see that the bottom row can be recognized to be Just Intonation, which we will now derive using a different approach.
| Table 9: Hardegree's Construction of Ptolemaic Tuning. | ||||||||
| Note | C | D | E | F | G | A | B | c |
| Ratio of Adjacent Note Values | 1 | 9/8 | 10/9 | 16/15 | 9/8 | 10/9 | 9/8 | 16/15 |
| Note Frequency | 1.0 | 1.125 | 1.250 | 1.333 | 1.500 | 1.667 | 1.875 | 2.000 |
Table 9: Hardegree's Construction of Ptolemaic Tuning. Ratio between adjacent notes are defined by fractions in the form of (n+1)/n.
2.3.1 Just Intonation
Just Intonation, also known as Just Tuning was an important way station along the way to the modern Equal Temperament Tuning. Its frequency ratios for individual notes are still often used as setting the ideal for musical chords. One of the few derivations of Just Tuning that I have seen was what I found in class notes, titled "Harmony and the Diatonic Scale," from a Mathematical Methods course at the University of Aberdeen. The author is
listed only as JRP. There were a series of notes and other course material by
JRP until about four years ago. No faculty or staff member in the department
currently has initials of JRP. In his paper, he derives three triads which
for C major meet the condition of having no error for any of the seven notes. I
discovered another source using the exact same triads. It was published in
1906. and is a high school level text titled "Physics" by Charles Riborg Mann
and George Ransom Twis, published in 1906. The material is contained in a
chapter titled "Musical Scale". The material is not in the revised edition
Before we start on the class notes, I must mention that I came across a Wikipedia article under the heading of Music that was titled the "Diatonic Scale". I had always thought that C major was called C major because the first note in C major is C. From this Wikipedia article I learned that since the start of the Baroque period that our major and minor keys are defined by a central triad. C major is C major because C is the tonic of the central triad. These terms will be defined shortly.
I will briefly present the ideas from the two sources mentioned above and show how they lead to Just Tuning. Following JRP, we define the Harmonic Series: f0, 2f0, 3f0, 4f0, 5f0. In this series, f0 is the fundamental frequency (i. e. C) and the multiples of that frequency are the harmonics of f0. We normalize the frequency of f0 to 1.0. The second and fourth terms are respectively one and two octaves above the fundamental and thus are normalized to 1.0. The remaining terms, 3f0 and 5f0, become the main actors. These two terms will be normalized to keep the values between one and two. The sequence becomes 3/2, 5/4. From the second column of Table 6, we identify 3/2 as G and 5/4 = 1.25 is to be preferred to the 1.27 value in Table 6 for E. We now have the three notes of the central triad where C is the tonic, CG is a perfect fifth with G defined to be the dominant and CE is a major 3rd and E is defined to be the sub-dominant. The dominant of the left triad is the tonic of the central triad. To determine what note is the tonic of the left triad, we can ask the question: What note "N" plays the same role to C that C plays to G. For simplicity, we will represent the frequencies of the notes by the notes themselves. We can represent this question by the equation N/C = C/G = 1/(3/2) = 2/3 and since C = 1 and normalizing again, we get N = 4/3. Again from Table 6, F has a frequency of 1.333 and we have a match and F is the Tonic of the Left Triad. The sub-dominant, S, of the left triad is S = (5/4)F and from above, F = (4/3) and S = (4/3)(5/4) =5/3, which is an improvement to the 1.69 value for A in Table 6. The tonic of the right triad is the dominant of the central triad and is therefore G. Now we need only the dominant and sub-dominant of the right triad. The dominant of the right triad is 3/2 that of G or (3/2)(3/2) = 9/4 and normalizing: 9/8. From Table 6 again, we find that the dominant of the right triad is D. Similarly the sub-dominant of the right triad is (3/2)(5/4) = 15/8 and from Table 6 is close to the 1.90 for B. For C major, we have now derived all seven notes and are displayed in the first and 3rd rows of Table 10. The second row gives the error measured in cents between the Pythagorean and Just Tunings. The RSS (root-sum-square) value at the right is computed using the error values for D through B tones. The method for computing RSS (root-sum-square) is discussed in a later section. As expected Pythagorean Tuning differs from Just Tuning only for A, B and E. The other rows of Table 10 will be discussed in a later section.
| Table 10: Comparison of Tuning Systems. | RSS Difference |
|||||||
| Note | C | D | E | F | G | A | B | |
| Cent Dif: Just vs. Pythag | 0 | 0 | -21.506 | 0 | 0 | 21.506 | 21.506 | 6.208 |
| Just Tuning Frequency | 1.0 | 1.125 | 1.250 | 1.333 | 1.500 | 1.667 | 1.875 | |
| Pythagorean Tuning Frequency | 1.0 | 1.125 | 1.266 | 1.333 | 1.500 | 1.688 | 1.898 | |
| Equal Temperament Frequency | 1.0 | 1.122 | 1.260 | 1.335 | 1.498 | 1.682 | 1.888 | |
| Cents Dif: Eq. Temp vs Pythag | 0 | 3.910 | 7.820 | -1.955 | 1.955 | 5.865 | 9.775 | 2.438 |
| Cents Dif: Just vs Eq. Temp | 0 | 3.910 | -13.686 | -1.955 | 1.955 | -15.642 | -11.731 | 4.057 |
Table 10: Comparison of Three Tuning Systems and Differences Measured in Cents for each Pair of Tuning Systems and with RSS (Root-Sum-Square) Measured in Cents and Computed for the Values of D through B tones on each Row.
The pattern of the three triads is F A C E G B D with the underlines indicating the left and right triads and with location of the Central Triad shown in bold font. This representation emphasizes the linking of the left and right triads to the Central Triad. Figure 4 provides a graphical representation of the triad and their linkages. Going from left to right in Figure 4, each tonic forms a fifth with the dominant/tonic to the right. The same applies to the dominants and sub-dominants at the top of the figure. Each vector is marked with the musical chord to which it corresponds.
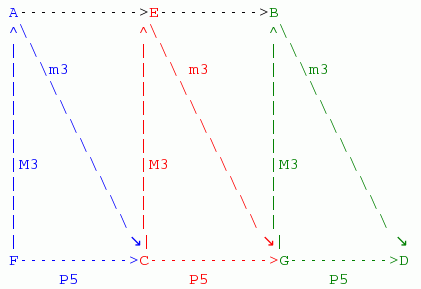
Figure 4: Directed graph representation of musical chords for left triad (blue),
central triad (red) and right triad (green). The notation A-->C indicates the
musical chord AC. P5 indicates a perfect 5th, (3/2 ratio, 7 semitones), M3 a
major 3rd, (5/4 ratio, 4 semitones) and m3 a minor 3rd, (6/5 ratio, 3
semitones)
If the use of three triads, or Just Tuning come close to perfection for generating musical chords for the seven notes of the octave, why aren't they in common use. In this case, the metaphorical serpent is what happens when we use this method for scales other than C. G major comes closest to having all notes at the correct frequency. In this case, the method generates G A+ B C D E F♯ where A+ is a note with a frequency 21.5063 cents above the value of 5/3 shown in Table 8. If we were to only play in G major, we could change the guitar or piano pitch to correspond to the new A+ and everything would sound wonderful. This obviously is not a valid solution. The ten other scales have between two and four notes which are not compatible with the frequencies for C major. For the eleven scales other than C, twelve new notes would have be defined, some notes being used in as many as four different scales. The new notes are
| A+ | D_ | E+ | B+ | G_ | A♯_ | F_ | C_ | D♯_ | C♯_ | G♯_ | F♯_ | (14) | |||
with frequency deviations of either 19.5526 or 21.5063 cents. Twenty cents is a fifth of a semi-tone and such a large error for a chord is considered unacceptable. It has proved to be impossible to develop a keyboard with 17 notes per octave so that either note of a sharp/flat (e.g. G♯/A♭) could be played. Adding an additional 12 notes per octave to the keyboard would be impossible. It is interesting to consider the possibility of a pianist playing on an electronic keyboard attached to a computer and with the score of the composition in the computer. If the pianist does not deviate from the composition, the computer could choose the proper flat or sharp and also track the changes of key during the composition so that the proper note from sequence 14 could be selected. There still might be a problem with the modulations between keys that typically occur in much of the music in common usage. We can now conclude that there does not appear to be any way to tune instruments to maintain the precise ratios of three-halves, four-thirds and five-fourths in all twelve scales. Thus we see the justification for equal temperament tuning where none of the ratios are precisely three-halves, four-thirds and five-fourths but are close enough so that most people cannot hear the difference. Equal temperament is the topic of the next section.
Table 11 allows us to see the compromises made by Equal Temperament Tuning and how the error is distributed among the different notes and between the different musical scales. The Cents Difference column uses eq. 9 to compute the difference between the Pythagorean Tuning frequency of a specific note and ET frequency of the same note. Remember that 100 cents corresponds to a semitone and that a tone with a 20 cent error is often audible, and thus unacceptable. That is why major thirds were not used with Pythagorean tuning. ET provides almost perfect P4s and P5s with less than 2 cents of error from the exact pitch ratios for these chords. D has a not-bad error of four cents and the three notes that were considered seriously off in Pythagorean Tuning do not fare as well with ET either. A is the best with six cents error, E has a not-good eight cent error and B has a bad 10 cent error. ET collapses the sharp/flat doublets of Pythagorean Tuning into a single compromise value somewhere between the two. The cents difference for the sharps and flats have a red font to distinguish them. Note that for F♯ and G♭, the ET compromise is precisely in the middle with 11.73 cents separating the ET value on each side from the Pythagorean sharp and flat. For the other four doublets, the Pythagorean sharp is favored , particularly for the A♯/B♭ doublet. The following column combines the Cents differences for the sharps and flats to show that the total separatioon is 23.460 cents which corresponds to the Pythagorean Comma..
The final column is going to require some explanation. I used Table 8, the Super Rows to generate the the seven diatonic tones for each of the 12 musical scales. First, I will go through the steps on how I generated values for the column and as a first step, I'm going to go to Table 8 and bring back the notes of G♯ major: G♯ A♯ C C♯ D♯ F G. From Table 11, we find the note in the second column and go over the seventh column to get the Cents error for that note. We then compute the sum of the squares:
| SoS = (7.820)2 + (3.910)2 + (9.775)2 + (5.865)2 + (1.955)2 + (-1.955)2 =214.034 | (13) |
Now we take the square root of SoS and divide by the number of terms that were squared and then summed. The result is RSS = sqrt(SoS)/7 = 2.090 cents. Thus we see that RSS (root-sum-square) is the square root of the sum of the squares divided by the number of terms. This proceedure is repeated for the other 11 scales. There is a complicating factor for F♯, which was discussed previously.
| Table 11: Comparison of Equal Temperament and Pythagorean Tuning | |||||||
| No. | Note | Pythag. Freq. | E.T. Freq. | Cents Dif. | Sum of Sharp/Flat Cents | RSS Cents Dif for each scale | |
| 0 | C | 1.0000 | 1.0000 | 0 | 2.090 | ||
| 1 | C♯ | 1.0535 | 1.0595 | 9.775 | 2.664 | ||
| 2 | D♭ | 1.0679 | 1.0595 | -13.685 | 23.460 | ||
| 3 | D | 1.1250 | 1.1225 | -3.910 | 3.305 | ||
| 4 | D♯ | 1.1852 | 1.1892 | 5.865 | 1.652 | ||
| 5 | E♭ | 1.2014 | 1.1892 | -17.595 | 23.460 | ||
| 6 | E | 1.2656 | 1.2599 | -7.820 | 4.673 | ||
| 7 | F | 1.3333 | 1.3348 | 1.955 | 1.652 | ||
| 8 | F♯ | 1.4047 | 1.4142 | 11.730 | 2.664 | ||
| 9 | G♭ | 1.4238 | 1.4142 | -11.730 | 23.460 | ||
| 10 | G | 1.5000 | 1.4983 | -1.955 | 2.664 | ||
| 11 | G♯ | 1.5802 | 1.5874 | 7.820 | 2.090 | ||
| 12 | A♭ | 1.6018 | 1.5874 | -15.640 | 23.460 | ||
| 13 | A | 1.6875 | 1.6818 | -5.865 | 3.979 | ||
| 14 | A♯ | 1.7778 | 1.7818 | 3.910 | 1.478 | ||
| 15 | B♭ | 1.8020 | 1.7818 | -19.550 | 23.460 | ||
| 16 | B | 1.8984 | 1.8877 | -9.775 | 5.379 | ||
Table 11: Comparison of Equal Temperament and Pythagorean Tuning. In the Cent Difference Column, red font indicates the adjacent sharp/flat pairs and the following column shows that the difference of the two is alway 23.460, which is the Pythagorean Comma converted to Cents. See the text for explanation of the last column.
So far in this paper, we have observed five different chords, all in the context of the white notes of C major. They are m3, M3, P4, P5 and M6. P4, P5 and M3 were within the context of Pythagorean tuning, the other two first appeared in the section on Just tuning and triads. It is now only a small step to show how we can determine how many ways each chord can be generated from the seven notes of C major. The two top rows of Table 12 list the 12 notes from which we derive all our musical keys. The top row assigns a sequential number to each note on the second row. Lets assume we want to know if there is some note x such that Dx is a P5 or perfect fifth. Reading the caption of Table 12, we see that P5 has a separation of seven semitones. In Table 12, D corresponds to 2, Now add seven semitones to 2 and we get 9. The number 9 is an A. Therefore DA is a P5 chord and P5 is in the Table at the intersection of the D column and the A row. If we were computing P5 for AX we would get 9 + 7 = 16. We would divide by 12 and take the remainder. This is simply a wraparound for the second row of Table 10. Formally, this operation is called the modulus and we write the equation as mod(9+7,12) = 4 and from the top two rows of the table, we get 4 corresponding to e. The lower case indicates the note is one octave higher which is always the case when the sum is 12 or higher. The rest of Table 12 can be computed using this method. If the sum places you at a sharp column, that means the chord does not exist for C major. You can use the Super Rows of Table 8 to generate another musical scale, print the top 2 rows of Table 12 and mark the notes in the second row that belongs to that key. You are now ready to compute chords for the new key. If you are interested in chords other than the ones I have listed, I recommend you access the Wikipedia article on Musical Intervals shown in ref. 2.
| Table 12: Generation of Musical Chords. | |||||||||||||
| 0 | 1 | 2 | 3 | 4 | 5 | 6 | 7 | 8 | 9 | 10 | 11 | 12 | |
| C | C♯ | D | D♯ | E | F | F♯ | G | G♯ | A | A♯ | B | C | |
| C | |||||||||||||
| D | |||||||||||||
| E | M3 | ||||||||||||
| F | P4 | m3 | |||||||||||
| G | P5 | P4 | m3 | ||||||||||
| A | M6 | P5 | P4 | M3 | |||||||||
| B | M6 | P5 | M3 | ||||||||||
| c | M6 | P5 | P4 | m3 | |||||||||
| d | M6 | P5 | P4 | m3 | |||||||||
| e | M6 | P5 | P4 | ||||||||||
| f | |||||||||||||
| g | |||||||||||||
| a | |||||||||||||
| b | |||||||||||||
Table 12. Generation of Chords using Separation of Semitones. P5 indicates a perfect 5th, (3/2 ratio, 7 semitones), P4 indicates a perfect 4th, (4/3 ratio, 5 semitones), M3 a major 3rd, (5/4 ratio, 4 semitones) and m3 a minor 3rd, (6/5 ratio, 3 semitones).
I promised I would get back to discussing the last three rows of Table 10. I am now ready to do it. In Table 11, we compared the 17 tones of the Pythagorean scale to the 12 chromatic tones of the Equal Temperament. In Table 10, we restricted ourselves to the seven-note diatonic scale, but we are are also comparing Equal Temperament Tuning to the other two tuning systems and we can do comparisons between the three systems of tuning. As we saw in Table 11 for the 12-tone scale, the RSS difference in the last column of Table 10 is a small RSS difference of two cents for the Cents Error Eq. Temp. vs Pythag in the next to last row. One might expect that the Just Tuning might have a smaller RSS difference from the Equal Temperament but we must remember that both the 17-tone Equal Temperament and Pythagorean Tuning each have a single value for semi-tone frequency ratio separation and the values are very similar. Just temperament has three different values for semi-tone separation and has respectively RSS differences of four and six from Equal Temperament and Pythagorean Tuning.
2.4 Figuring Out a Couple of Things
From the time I was a child, I wondered about the arrangement of keys on the piano. Learning of equal temperament and the use of the twelveth root of two deepened the mystery. When I first started calculating the Table 1 of this paper and then successively observing the white notes of the piano in Table 2, the black notes in Table 3, and then the separation of the black notes into flat and sharp doublets in Table 4, it gave me a sense of awe such as I had never had before in studying mathematics. Even as I was discovering why the black and white notes are laid out as they are on the piano, I encountered new mysteries such as that when the octave is viewed from the perspective of Table 4, the ratios between all the sharp/flat doublets are equal to the Pythagorean Comma. Once the anomalous B_ is removed, the ratios between all the other frequencies on the right side of Table 4 are precisely specified by 256/243 which is approximately equal to 1.0535.
I have just recently realized that there is a simple explanation. The key is found by looking at the positions of adjacent musical notes in the matrix of Table 7. The table matches the normalized frequencies to musical tones and the position in the table specifies the powers of four-thirds and three-halves. We know from eq. 8, that we can compute the frequency ratio between any two notes in Table 7. Lets make a table that shows the linkages of all notes within roughly an octave that are separated by the ratio of 256/243. Note that there are two instances of four note sequences, with the ratio of 1.0535 between each adjacent pair in the sequence. As an example, lets consider the ratio between D♭ which is at position (4,3) in Table 7 and D which is at position (7,1) in Table 7. Applying these values to Eq 8, we get
R12 = (4/3)(7-4) (3/2)(1-3) = 256/243.
We can thus see why the ratio applies everywhere except for the ratio between the sharp-flat pairs. Now to the flats and sharps. Table 13 shows the five flat-sharp pairs and their positions in Table 7. Notice that for every pair of of adjacent notes on each line, the positional difference for the first and second cordinates yields (-7,5). Applying Eq. 8, we get 312/219 ~= 1.0136, the Pythagorean Comma and we see the results in Table 13. The mystery is solved.
| Table 13: Triple and Quadruple Linkages of Ratios = 256/243 | |||||||||
| Link 1 | Link 2 | Link 3 | Link 4 | Common Distance on Matrix between Adjacent Links | |||||
| (a,b) | note | (c,d) | note | (e,f) | note | (g,h) | note | ||
| 1,5 | D♭ | 4,3 | D | 7,1 | D♯ | (3,-2) | |||
| 0,6 | E♭ | 3,4 | E | 6,2 | F | 9,0 | F♯ | (3,-2) | |
| 2,5 | G♭ | 5,3 | G | 8,1 | G♯ | (3,-2) | |||
| 1,6 | A♭ | 4,4 | A | 7,2 | A♯ | (3,-2) | |||
| 0,7 | B♭ | 3,5 | B | 6,3 | C | 9,1 | C♯ | (3,-2) | |
Table 13. Triple and Quadruple Linkages of Ratios = 256/243, The Common Distance of (3,-2) used in Eq. 8 yields 256/243.
| Table 14: Computation of Matrix Distance for Ratios = Pythagorean Comma | ||||||
| Sharp | Flat | Distance on Matrix | ||||
| (a,b) | note | (c,d) | note | |||
| 8,0 | C♯ | 1,5 | D♭ | (-7,5) | ||
| 7,1 | D♯ | 0,6 | E♭ | (-7,5) | ||
| 9,0 | F♯ | 2,5 | G♭ | (-7,5) | ||
| 7,0 | G♯ | 0,5 | A♭ | (-7,5) | ||
| 6,2 | A♯ | 0,7 | B♭ | (-7,5) | ||
Table 14: Computation of Matrix Distance for Ratios Equal to the Pythagorean Comma. The Matrix Distance of (-7,5) used in Eq. 8 yields Pythagorean Comma.
Another aspect of Pythagorean Tuning that has had an element of surprise to me is that it comes so close to having the correct tuning for each of the three notes: A, B and E as specified in Table 7. Looking back at this table, we see that the the preferred tunings normalized relative to C are respectively 5/3, 15/8 and 5/4. These values all contain a factor of five and therefore can only be approximated by powers of four-thirds and three-halves. The computed error between the Fnorm(2,2) specified for each note in Table 6 divided by the frequency for the same note in Table 7 gives us the ratio to be used in eq. 12 to compute the error measured in cents. Computing this error for all three notes, the same error is computed each time. To see what is happening, lets do some calculations. First, lets compute the precise value of Fnorm(2,2) for A. From Table 7, C is at position (3,0) and therefore has a value of (4/3)3 = 64/27. The value of A normalized to C (and also normalized to be between one and two) is 4/(4/3)3 = 33/24. Dividing by 5/3 yields 33/24(3/5) = 81/80. I repeated the calculations for B and E and - SURPRISE - I again calculated 81/80 each time. Applying eq. 12 to compute the logorithmic error, I obtain 21.5 cents which is almost the same as the cents error for the Pythagorean Comma, which has always been considered an unacceptible error for musical compositions. I remember having seen the 81/80 constant previously so I did a Google search. I found this definition:"The syntonic comma is defined as the difference between the Pythagorean tuning and just tuning of the major third. The difference between the just third (5/4) and the Pythagorean third (81/64) is 81/80, calculated as follows: 81/64 x 4/5 = 81/16 x 1/5 = 81/80. The syntonic comma is also the difference between the Pythagorean and just tunings for all diatonic intervals other than the fourth and fifth, which are the same in both tunings."(ref. 8) This is yet another instance where the same number occurs multiple times with no obvious explanation for the repeats, Possibly we have to thank serendipity that Pythagorean tuning providing values that are sufficiently close to the preferred tuning values that equal temperament can be applied with results that satisfy most listeners.
It is an interesting sidenote that the position in the Table 1 matrix for the tone A is in the position from which all other tones are generated and this A tone has an error of 21.5 cents.
What I thought would be a relatively simple exercise to make Table 1 and try to see why the white notes and the black notes are where they are kept expanding far beyond what I ever thought would happen. It was fairly simply to use Table 2 to match the pattern of half tones and full tones in the table to the keyboard but I was intrigued that one octave up I encountered the black keys and the progression of studying one table to generating the next table continued. I also found it very interesting that each step of manipulating data into new forms helped me to see artifacts that might otherwise have escaped me. I first changed tabular data to graphical data (Fig. 2), changed it back to tabular data (Table 7) with new insight, then converted the tabular data back to graphical (Fig. 3) but still using a tabular format and finally extracted two rows which were placed in a table from which eleven of the musical keys of Western Music can be easily extracted. The new table also provided a different perspective on the Pythagorean Comma. It was also shown that the Central Triad of C major along with the neighboring Triads could be derived by matching the relative frequencies derived from the Harmonic Series with the relative frequencies of the tables in this paper. In Section 2.4, I showed why only two ratio values are sufficient to characterize the spacing of the seven white notes, five flats and five sharps that can be derived from Pythagorean tuning.
I started my efforts wondering about the locations of black keys on the piano and end it with an admiration of the glimpse I have caught of the mathematical architecture of music and with the serendipity that allowed powers of five to be at least approximated by powers of four-thirds and three-halves and thereby allow equal temperament to do its thing. One of my lasting memories will be in remembering that flats and sharps are separated by a Pythagorean spiral.
I want to acknowledge the encouragement of a long time friend and colleague, Anne Hoey, who has worked with me for many years. This is not the only paper that has benefited from her editing. She also introduced me to the Cycle of Fifths. I also want to acknowledge the use of a spreadsheet and text writer from the Open Office Organization. Wikipedia has also aided my study of musical theory.